


Introduction
Running long jump is a closed-skill-type sport in which sprint speed and jump technique influence jump distance. It is a track-and-field event that is widely adapted in PE classes for young people. In PE classes, which is different from the training undergone by athletes, there is not enough time to enhance physical fitness or sprint speed to improve physical resources, so students are required to focus on improving their jump skill including their approach run, takeoff, air posture, and landing. Many studies have reported that jump distance would be strongly related to the maximal speed of the approach run [1-5], and sprint speed as a physical resource is important in determining jump distance. Therefore, jump distance is considered a reflection of both physical resources and jump skill.
On the basis of IkaiŌĆÖs formula: Performance = Skill Ōł½ (Physical resources) (according to Miura et al.[6]), Azuma and Matsui [7] proposed the ŌĆ£speedŌĆōeffectiveness indexŌĆØ (SEI). It is the ratio of actual jump distance to estimated jump distance derived by substituting the subjectŌĆÖs 50-meter run time into a linear regression equation correlating the 50-meter run time with actual jump distance (based on all subjects of a target group). The SEI is thus regarded as the effective (or ineffective) use of sprint speed in jump distance, and educational availability with regard to the SEI as a relative evaluation of jump skill was expected [7]. Moreover, it was suggested that the SEI would be an objective indicator that provides a relative evaluation of jump skill that considers learnersŌĆÖ readiness and physical fitness ,including sprint speed.
However, Azuma and Matsui [7] had limited subjects (17- to 18-year-old male students) when they reported on runninglong-jump SEI. Gender differences are well documented in world jump records (17.5%) in track and field [8]; therefore, it is necessary to investigate the SEI of female students when instructing and/or evaluating jump skill in PE classes.
This study aimed to estimate the running-long-jump SEI in female college students and to examine its applicability in evaluating jump skill in PE classes.
Methods
Subjects
The subjects tested in this study were 62 female college students of KOSEN (National Institute of Technology [9]) in Hokuriku district aged 17ŌĆō18 years (age: 17.2 ┬▒ 0.4 years, height: 158.9 ┬▒ 5.6 cm, weight: 51.8 ┬▒ 6.4 kg). None of the subjects had a history or disorder affecting their ability to perform the running long jump. This study was conducted as a part of PE class, and the subjects were the students in this class. A written consent was obtained from all subjects followed by provision of a detailed explanation of the purpose and procedure of this study and the potential for its publication. This study was approved by the Research Ethics Committee of the National Institute of Technology, Fukui College (Permission numbers: 29-1, 30-1, and 30-2).
Procedures
Data were collected from the PE class at the fourth session (Day 4) of five consecutive sessions (Days 1ŌĆō5). During the first session (Day 1), the subjects were instructed about the approach run, takeoff, air posture, and landing before the trial, and they then performed initial standing-long-jump trials into a sand pit and practiced takeoff using a springboard. In addition, their 50-meter run time was measured at the same session. Then, the subjects repeatedly practiced the approach run, takeoff, air posture, and landing while gradually lengthening the approach-run distance (Days 2ŌĆō4) with the aim to improve their jump distance as much as possible. On Day 4, the subjectsŌĆÖ jump distances using maximal effort were measured with self-selected approach-run distances. The subjects reattempted the maximal-effort jump and reflected on their learning in the last session (Day 5).
Analysis
To determine the effect of physique and the 50-meter run time on jump distance, a multiple regression analysis was performed using the stepwise method [7]. It was hypothesized that each subjectŌĆÖs jump distance (JD) is related linearly and additively to their height (x1), weight (x2), and 50-meter run time (x3) and can be correlated as y = a1 x1 + a2 x2 + a3 x3 + constant, where a1, a2, and a3 are regression coefficients. To clarify more suitable variables for the dependent variable, all the independent variables were introduced first for the analysis, and then suitable variables were chosen so that F value of a final multiple regression model, and partial F value of the independent variables chosen became maximum and significant at p < .05 for the F distribution. The standardized regression coefficients of the independent variable units were calculated as an.(SD.xn/SD.y) (where SD represents the standard deviation).
Then, the subjectsŌĆÖ speedŌĆōeffectiveness index (SEI) was calculated according to Azuma and MatsuiŌĆÖs definition [7] definition as follows:
where actual jump distance is the subjectŌĆÖs maximum recorded jump distance and estimated jump distance is calculated by substituting the subjectŌĆÖs 50-meter run time into a linear regression equation as described earlier. To characterize the SEI distribution for the subjects, a histogram was drawn, and skewness, kurtosis, and normality were calculated. In addition, subjects were divided into a high-SEI group (SEI is greater than or equal to 1; n = 30) and a low-SEI group (SEI is below 1; n = 32), and the height, weight, and body mass index (BMI) of the two groups were compared.
Statistics
A multiple regression analysis was performed through a stepwise method. The correlation between the 50-meter run time and jump distance was characterized by calculating PearsonŌĆÖs correlation coefficient. Similarly, the correlations between SEI and physical performances (50-meter run time and jump distance) were also calculated. In addition, the correlation matrix between variables (jump distance, height, weight, and 50-,eter run time) was organized as a table. The KolmogorovŌĆōSmirnov test determined the normality of SEI distribution. The differences between the high- and low-SEI group in terms of average height, weight, and BMI were examined using unpaired t-test, and effect size (ES, CohenŌĆÖs d) was also calculated. Differences with p < .05 were considered statistically significant.
Results
Multiple regression analysis
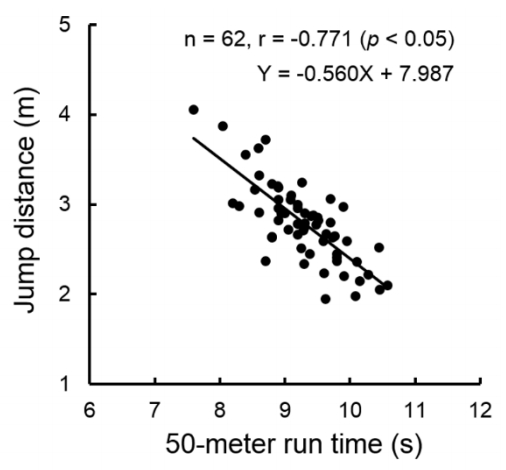
The multiple regression analysis revealed that height and weight were not significant independent variables; rather, the 50-meter run time (50mRT) was found to be significant (Table 1 and 3, p < .05), Jump Distance = ŌłÆ.560 ├Ś 50-Meter Run Time + 7.987, explaining 59.5% of the observed variance in jump distance by a significant independent variable (50-meter run time).
Relation between 50-meter run time and jump distance and SEI calculation
As shown Table 3 and Figure 1, the correlation between 50-meter run time and jump distance was statistically significant (r = ŌłÆ.771, p < .05) and the SEIs ranged from .736 to 1.200 (Figure 2), and the skewness and kurtosis of the distribution were ŌłÆ.180 and .256, respectively. The test statistics and P-value obtained through the KolmogorovŌĆōSmirnov test were .099 and .661, respectively (P > .05), making SEI normality statistically significant.
Relations between SEI and physical performances
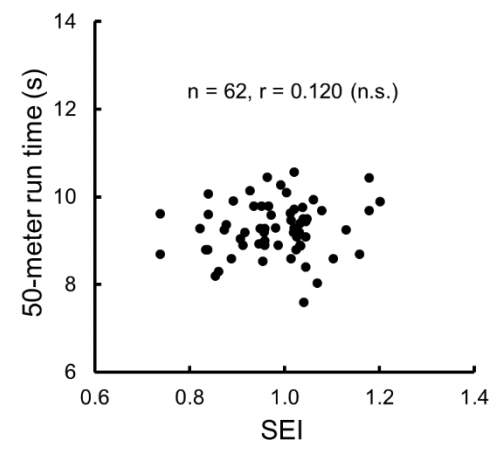
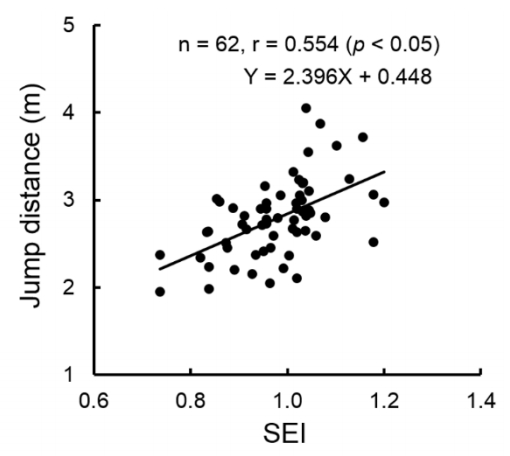
The correlation between SEI and 50-meter run time was not statistically significant with an r value of 0.120 (Figure 3) and the relation between SEI and jump distance was characterized by a linear regression equation, Jump Distance = 2.396 SEI + .448, indicating a statistically significant positive correlation with an r value of .554 (Figure 4, p < .05).
Physique comparison between high- and low-SEI groups
No significant differences were found in height, weight, and BMI between both groups (Table 2). The effect sizes were the small to middle levels.
Discussion
Azuma and Matsui [7] indicated a potential relative SEI evaluation that determined the relation between 50-meter run time and jump distance in a group of male college students. In this study, the SEIs of female college students of the same age group were examined and compared.
SEIs in this study ranged from .736 to 1.200, and Azuma and Matsui [7] noted that for the male college student group, the range was .655 to 1.275. In the female sample, SEIs were distributed in a narrow range, and the skewness (ŌłÆ0.180) and kurtosis (0.256) of the distribution were larger and smaller than those in the male group, respectively (skewness and kurtosis of the distribution for the male group were ŌłÆ.510 and .607, respectively). However, the skewness and the kurtosis of the distribution were both within ┬▒2 [10], and the KolmogorovŌĆōSmirnov test determined SEI normality in the female sample. Therefore, it was considered that SEIs of female college students would also distribute normally like those of the male group as reported by Azuma and Matsui [7].
The multiple regression analysis revealed that only the 50-meter run time would be the significant independent variable, which was different from previous findings by Azuma and Matsui [7]. For the male college students, weight was deemed a significant independent variable along with the 50-meter run time, with both accounting for 44% (30% and 14%, respectively) of the jump distance variance. However, in this study, weight was not a significant variable according to the multiple regression analysis, and 59.5% of the jump distance variance was attributed to the 50-meter run time only. Azuma and Matsui [7] indicated that the weight coefficient was so negative on a multiple regression equation that an increase in weight would be disadvantageous to the jump distance of male college students. Weight consists of fat mass and lean body mass. The former is simple weight as an inert material; the latter, which includes muscle mass, is used for muscle strength development. Fat mass would have a potentially strong association with jump distance because weight was negatively related to jump distance in male college students. On the other hand, if all variables were used in multiple regression analysis instead of the stepwise method, the standardized regression coefficients of height and weight would be .098 and .103, respectively. Those coefficients were relatively smaller (12 ŌĆō 13%) than that of 50-meter run time and also not significant in stepwise method.
The disadvantages of weight to jump distance were not necessarily observed in female college students, who had larger weight in this study. It was considered that subjects with larger weight would develop suitable or adequate muscle strength in jumping. Generally, females have greater body fat percentage and smaller lean body mass [11]; thus, females have less muscle strength than males [12-14]. This shows obvious gender differences in body composition and strength, and for this reason, gender differences in body composition would potentially be associated with weight not being a significant dependent variable in female college students. To clarify this, it is necessary to compare between male and female college students by adding body composition parameters as dependent variables in a multiple regression analysis.
On the other hand, one may easily expect that students with excellent 50-meter run times can obtain greater horizontal speed in the approach run. This is based on a negative correlation between 50-meter run time and jump distance [7,15] and a positive correlation between approach-run speed and jump distance [1-5]. Hence, it is obvious that 50-meter run time would considerably account for jump distance variance in a multiple regression analysis. However, 50-meter run time accounted for most of the jump distance variance in female college students (59.5%) compared with male college students (30%) as reported by Azuma and Matsui [7]. In other words, it was thought that female college studentsŌĆÖ jump distance would be more inclined to depend on sprint speed than the jump distance of the male group. If jump distance variance, which cannot be attributed to physique and sprint speed, is assumed to be accounted for by jump skill, then jump skill accounts for a smaller portion of jump distance variance in female college students than in male college students. Jump skill includes the technique in which horizontal approach-run speed transfers vertical (initial) speed at takeoff. Therefore, because more muscle strength is needed, unnecessary load (fat mass) is avoided at takeoff, and it was possible that gender differences in muscle strength [12-14] and/or body composition [11] would be associated with gender differences in jump skill accounting for jump distance variance. In this study, 50-meter run time was adopted as an independent variable to explanate the jump distance instead of the approach-run speed. To measure the approach-run speed, the dedicated equipment must be prepared in PE class. We planned to develop a convenient index for teachers to evaluate the jump skill of running long jump in PE class, the sprint ability was represented by 50-meter run time which has been widely adopted as one of the physical fitness tests for running ŌĆśspeedŌĆÖ in Japan.
When SEI exceeds 1, effective use of speed in jump distance (i.e., jump skill) is found to be more than average for the group. Hence, in a viewpoint where individual jump skill can be compared among students with varying sprint speed, the educational utility value of SEI in PE classes was expected [7]. Because the jump skill evaluated by SEI may be a good indicator independently of individual physical resources. It was thought that the degree of jump skill in female college students accounting for jump distance variance (<40%) would not exceed that in male college students. However, SEI, which eliminated sprint speed as a contributing factor, distributed before or after a median value, had no extreme deviation and was not associated with physique parameters in female college students. Furthermore, considering the calculation for estimated jump distance used by the linear regression formula between 50-m run times and the actual jump distances (Figure 1), SEI is regarded as an index standardized by 50-m run times. Therefore, it is conceivable that no significant correlation exists between 50-m run times and SEI (Figure 3); however, there is a positive relationship between actual jump distance and SEI (Figure 4). Hence, it was suggested that subjects with large jump distances might possess high jump skill, which is not a physical resource (high sprint ability). Therefore, it is sufficiently suggested that SEI in female college students could provide a relative evaluation of jump skill in running long jump depending on their physical resources.
In addition, Matsui and Azuma [16] reported a unique trial to estimate optimal approach-run distance by quadratic regression equation approximation among different approach-run distances and jump distances in male college students. The results indicated that low-SEI students tend to increase their jump distances using their estimated approach-run distances compared with those using their self-selected approach-run distances. This implies that low-SEI students who cannot effectively apply sprint speed to their jump distance are not able to determine their appropriate approach-run distance by themselves. Hence, it is suggested that the SEI may influence jump skill including the ability to determine approach-run distance. Also, for female college students, future research is expected to clarify concrete jump skill profiles expressed by the SEI. When having an opportunity to determine optimal approach-run distance as the study of Matsui and Azuma [16] or evaluating take-off technique from the viewpoint of kinematics for female students, it is expected that the rationale would be given to the applicability of SEI for the evaluation of jumping skill of running long jump in PE classes.
Conclusions
In this study, we aimed to determine the running-long-jump SEI in a PE class and to examine the applicability of this metric in evaluating the jump skill of female college students. The multiple regression analysis indicated that the regression coefficient of the 50-meter run time was significant (p < .05), accounting for 59.5% of the jump distance variance. In addition, the SEI was normally distributed in the sample population. Moreover, no significant differences were found among height, weight, and body mass index between high-SEI (greater than or equal to 1) and low-SEI (below 1) groups. The SEI was regarded as a measure of jump skill that estimates the effective (or ineffective) use of sprint speed (physical resources) in jump distance (performance). Although jump skill accounted less for performance than sprint speed, the SEI would possibly be useful as a relative criteria of jump skill based on individualsŌĆÖ physical resource without consideration of physique in the case of female KOSEN college students.