


Introduction
Ankle sprain is among the most common sports-related injuries [1]. It is caused by stretching of the fibers or the collagen of the ankle ligaments, thereby leading to partial or complete fiber disruption [2]. Approximately 40%–70% of individuals with ankle sprains develop chronic ankle instability (CAI) [3]. CAI is a common orthopedic condition characterized by decreased strength, impaired postural control, and altered movement during a functional task [4]. In addition, patients with CAI commonly experience residual symptoms at the ankle joint such as pain and weakness [5].
Individuals with CAI have unique movement patterns associated with possible factors of other chronic injuries during sports maneuvers [6]. Previous studies showed that patients with CAI performed gait movement with increased inversion during the swing phase and decreased dorsiflexed ankle joint angle during the stance phase [7-9]. Patients with CAI had a lower knee flexion angle and a higher hip flexion angle, in addition to the ankle joint, during a landing task [8]. Kim et al [10]. investigated the effects of CAI on cutting movements. Results showed that patients with CAI had a lower ankle dorsiflexion angle and a higher knee and hip flexion angle. Consequently, CAI altered the kinematic patterns of not only the ankle but also the whole lower extremity during numerous dynamic movements. As those movements, such as landing and cutting movements are the majority of explosive sports, athletes with CAI can be exposed to altered mechanical load in the lower extremity. Hence, an understanding of the different unique movement patterns that could influence injury risk and athletic performance in athletes with CAI is important [11].
Previous reports have identified the typical gait patterns in CAI. However, no study has investigated the lower limb joint angle during sprinting. In several explosive sport events, such as soccer, rugby, basketball, and football, sprinting is among the fundamental and critical movements; therefore, lack of knowledge on the effects of CAI on sprinting is an issue for practitioners. In sprinting, the ankle joint was more plantarflexed during touchdown than during slow and moderate running [12]. Nevertheless, in patients with CAI, an altered sense of joint position could place the ankles into a more plantarflexed position, which is associated with a higher risk of developing ankle symptoms [6,13]. If this altered joint angle during sprinting caused by CAI persists over the long-term, unique movement patterns could be a risk factor of lower extremity injury. Malliaropoulos et al [14]. conducted a long-term cohort study investigating the influence of ankle sprain. Results showed that the players with a history of ankle sprains had a significantly higher incidence of hamstring injuries than healthy players. These injuries are a major cause of time lost from sport participation in elite sprinters. Thus, the lower extremity joint angles of patients with CAI during sprinting should be investigated to deepen our understanding on how athletes deal with ankle instability at a greater mechanical load during gait and to provide practical insights on well-designed training and rehabilitation programs.
Therefore, the current study aimed to evaluate the joint angles of the lower extremity during sprinting between elite sprinters with CAI and healthy controls. We hypothesized that compared with healthy controls, elite sprinters with CAI can have decreased dorsiflexion and increased inversion at the ankle during the stance phase, increased plantarflexion at the ankle during the swing phase, and decreased knee flexion and more hip flexion during the stance phase.
Methods
Subjects
In total, 14 elite male college sprinters (age: 20.5 ± 1.6 years, height: 1.76 ± 0.05 m, and mass: 67.8 ± 5.3 kg) were recruited in this study. Among them, seven presented with CAI, and seven were considered as healthy controls. The inclusion criteria for the CAI group were as follows: 1) a history of at least two acute unilateral ankle sprains and 2) self-reported ankle instability (a Cumberland Ankle Instability Tool [CAIT] cutoff score of ≤24). The inclusion criteria for the control group were as follows: 1) no history of ankle sprain and 2) a CAIT cutoff score of ≥28 [5]. The exclusion criterion was a history of surgery for any lower extremity injury within 3 months. Before the start of the experiment, the participants were provided with verbal and written details about the purpose of the study and the potential risks of the experiment. All participants provided a written informed consent, and the study protocol was approved by the research ethics committee of the university (approval number: 021-137).
Experimental protocol
All participants performed warm-up exercises, which included jogging, dynamic stretching, and sprinting with submaximal effort, for 30 min. Then, they ran two times at 7.5 m/s on a motorized treadmill (ORK-7000, Iwate, Japan) in an indoor laboratory. In each trial, the belt speed was monitored using a handheld tachometer (HT-3200, ONO SOKKI, Kanagawa, Japan). During each running trial, the participants performed 5-second steady-speed running on the treadmill. The participants wore their own shoes. The trial, during which the participant was better satisfied with their running technique and consistency was selected for further analysis. The participants took time to recover between each trial.
Data collection and processing
The three-dimensional marker motion was captured using an eighteen-camera analysis system at 250 Hz (Vicon Motion System, Ltd., Oxford, the UK). The X, Y, and Z axes of the global coordinate system were defined as the medial-lateral, anterior-posterior, and superior-inferior directions, respectively. Forty-seven retro-reflective markers (with a diameter of 14 mm) were attached on the anatomical landmarks of the whole body of each participant [15,16]. The anatomical landmarks included the vertex, tragions, anterior and posterior suprasternal notch and xiphoid process, points of the lateral lowest ribs, anterior and superior iliac spines, posterior superior iliac spines, head of the two third metacarpal bones, styloid processes of the ulnas and radii, bilateral epicondyles of the two humeri, top part of the acromions, and anterior and posterior side of the shoulders. Moreover, the markers were placed on the bilateral toes, posterior calcanei, medial and lateral aspects of the first and fifth metatarsal heads, malleoli, epicondyles of the femurs, and greater trochanters. Notably, the markers on the toes, posterior calcanei, and medial and lateral aspects of the first and fifth metatarsal heads were securely placed on the participants’ shoes.
The calculation of all joint angle data was performed using MATLAB R2021a (MathWorks Inc., Natick, MA, the USA). The data were smoothed using a fourth-order Butterworth low-pass digital filter with a cutoff frequency of 15 Hz. A biomechanical model and the definition of each joint center were similar to those in a previous study [17,18]. We calculated the joint angles using the joint coordinate system of each hip, knee, and ankle joint in accordance with previous studies [17,18]. The running cycle was normalized to 100% from the first ground contact to the subsequent ipsilateral ground contact.
Statistical analysis
Statistical parametric mapping (SPM, version 0.4) was applied to identify possible differences between the CAI and control groups during the whole running gait cycle using MATLAB. This statistical calculation has the advantage of comparing time-series data and has widely been used in many previous relevant studies [19]. The normality of data was tested before performing SPM using the Shapiro–Wilk test. The normality of data was evaluated before performing SPM using the Shapiro–Wilk test. The data on ankle joint angle had a normal distribution. The 1d spm two-sample t-test over the normalized time series was used to determine significant differences between two groups [19]. In addition, to further interpret group differences, effect sizes were calculated using Hedges’ g, which is a more significant approach in comparative studies.
In terms of demographic characteristics, data about the number of ankle sprain events, self-reported ankle function, step length, stance time, flight time, and step frequency were compared using the unpaired t-tests. The Statistical Package for the Social Sciences software (version 25, IBM Inc., Armonk, NY, the USA) was used, and a p value of ≤0.05 was considered statistically significant.
Results
<Table 1> shows the number of ankle sprain events, self-reported ankle function, and participants’ 100m personal best time. There were no significant differences in terms of age, height, weight, and 100m personal best time between the CAI and control groups. The CAI group had significantly more history of ankle inversion sprains and significantly lower CAIT scores compared to the healthy control group (p < 0.001). <Table 2> depicts information about step length, stance time, flight time, and step frequency. There were no significant differences between two groups in terms of those step parameters.
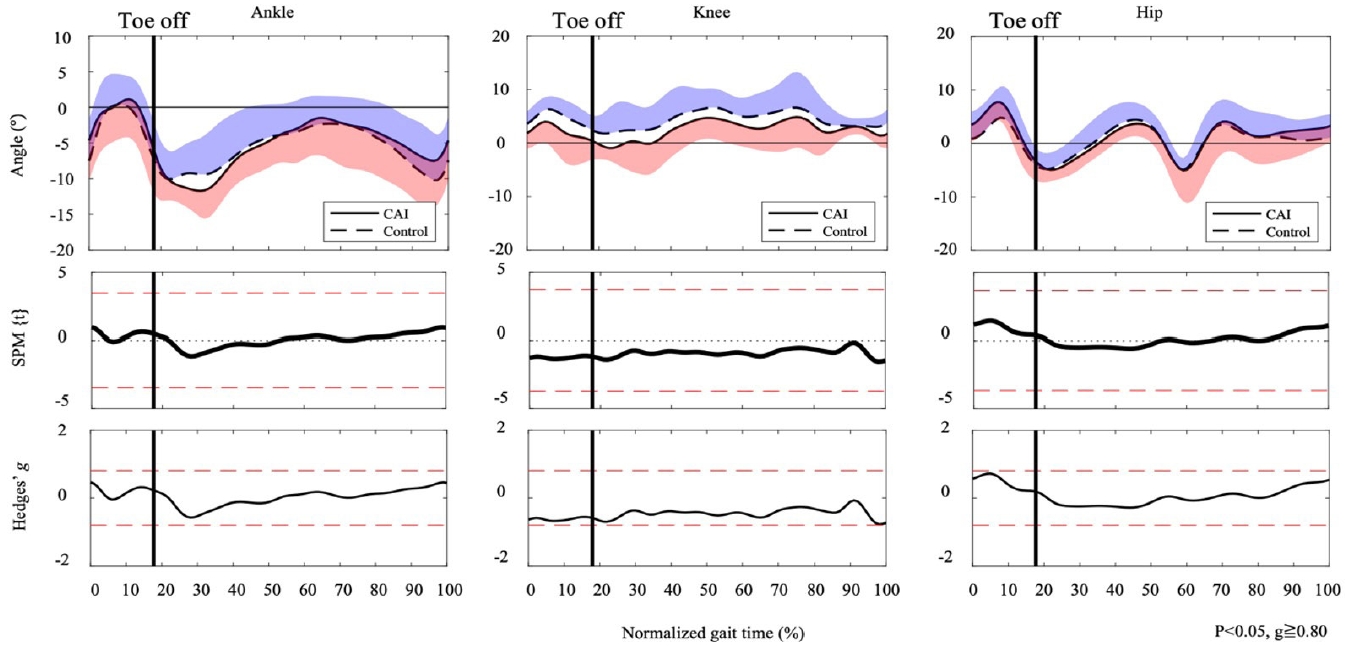
During the running cycle, there are significant differences in ankle dorsiflexion and knee flexion angle between the CAI and control group. One supra-threshold cluster (9%) exceeded the critical threshold of 3.729 as the ankle dorsiflexion/plantarflexion joint angle in the CAI group was significantly more positive than the control group <Figure 1>. Moreover, one supra-threshold cluster (1-9%) exceeded the critical threshold of 3.645 as the knee flexion/extension joint angle in the CAI group was significantly more positive than the control group <Figure 1>. Ankle and knee joint angle in the horizontal and frontal planes during the running cycle did not exceed the critical threshold <Figure 2 and 3>. Furthermore, regarding to hip joint angle in the sagittal, horizontal, and frontal planes during, no supra-threshold cluster exceed the critical threshold.
Ankle, knee, and hip joint angles in the sagittal plane had large effect sizes. In the sagittal plane, the CAI group exhibited greater ankle dorsiflexion angles at both 0%-19% (g = 0.83-1.89) and 79%-100% (g = 0.83-1.53). Similarly, knee flexion angle was higher in the CAI group at 0%–20% (g = 0.80–2.00) and 93%–100% (0.96–1.68). Additionally, the CAI group showed lower knee external rotation angles in the horizontal plane at both 27%-31% (g = 0.85-1.03) and 97%-99% (g = 0.83-0.89). Furthermore, hip flexion angle was higher in the CAI group at 0%–15% (g = 0.80–1.25) and 64%–100% (g = 0.81–1.54). Lastly, the CAI group also demonstrated higher hip external rotation angles at 80%-86% (g = -0.88-0.82).
Discussion
This study aimed to compare the ankle, knee, and hip joint angles during sprinting between patients with CAI and healthy controls. We collected data on three-dimensional lower limb joint angles during running at 7.5 m/s on a treadmill for 5 seconds. Results indicated that the ankle dorsiflexion and knee flexion angles in the CAI gourp during the stance phase were uniquely larger than the control group in the sagittal plane. Furthermore, large effect sizes indicated that the dorsiflexion and flexion angle in the sagittal plane of the lower extremity increased from the late swing phase to the stance phase between the CAI and control groups. Nevertheless, there were no significant differences in the ankle joint angle in the frontal and horizontal planes during the running cycle.
While running at 7.5 m/s, the CAI group had increased ankle dorsiflexion at 0%–19% and 79%–100% of the running cycle <Figure 1>. Moreover, they had increased knee flexion at 0%–20% and 93%–100% and increased hip flexion at 0%– 15% and 64%–100% of the running cycle <Figure 1>. These increments of flexion angle represented from the late swing to the late stance phase. Thus, these results were somehow contrasting to our hypotheses. Due to impaired kinesthesia of ankle plantarflexion, patients with CAI had decreased dorsiflexion at the stance phase and increased plantarflexion at the swing phase during running and walking [7,9]. Moreover, during walking, there were no significant differences in the knee and hip joint angles between patients with CAI and healthy controls [8,9]. Therefore, this study could present the unique features of altered joint angles during sprinting in patients with CAI. In addition, it showed that increased ankle dorsiflexion and larger knee and hip flexion angles could be caused by a feed-forward motor adaptation to counter large external loads at the initial contact during sprinting. Moreover, sprinting has similar fundamental structures to slow and moderate speed running. However, it is essential to meet further mechanical demands for establishing this dynamic gait movement [20,21]. Notably, sprinting has a greater GRF within a shorter contact time than slow speed running [20]. We generally place the ankle joint in a plantarflexed position to load and reload this significant mechanical power [21]. However, this joint position is anatomically vulnerable due to the structure of the talus, and precise regulation of ankle stability in sprinting is important. Therefore, healthy athletes with advanced motor control could adapt to this vulnerable situation. In contrast, because of somatosensory impairment and neuromuscular control deficits, patients with CAI can experience the giving way episode in such a vulnerable situation [13]. Accordingly, patients with CAI could adapt to this demanding situation with the following strategies. Caulfield et al [22]. showed that patients with CAI had increased ankle dorsiflexion and knee flexion at pre-landing during a single-leg landing task. There is no ground reaction force affecting ankle and knee joints at pre-landing. Thus, feed-forward motor control affects the lower extremity of patients with CAI [22]. Increased ankle dorsiflexion at pre-landing can protect the lateral ligament against stretching in the plantarflexed position [22]. Furthermore, previous studies examining muscle activity during hopping have reported that patients with CAI exhibited increased muscle activity of the tibialis anterior during the pre-contact phase compared to healthy controls in order to prevent ankle sprain [23]. Thus, the CAI group may prepare greater ankle dorsiflexion joint angle with large dorsiflexor muscle activity to avoid further ankle sprain. Moreover, to structurally stabilize the ankle joint, the CAI group utilized a larger ankle dorsiflexion angle during the stance phase compared to the control group. On the other hand, this study showed that patients with CAI used large knee and hip flexion at pre-contact to prepare for a large impact during the stance phase. Increment in knee and hip flexion during the stance phase prolongs the moment arm of these two joints against the GRF [24]. This flexed posture enables them to make more contribution to the supporting force, which consequently results in compensation for the dysfunction of the ankle joint. Accordingly, patients with CAI had altered lower extremity joint angles from the late swing phase to the late stance phase, which then helps provide joint stability and resists large external loads with feed-forward motor control programs. Furthermore, such a strategy is considered to be an important control for increasing running speed in general, and it is thought to be used to improve sprint performance especially in individuals with unstable ankle joints.
While sprinting at 7.5 m/s, the ankle joint angles in the horizontal and frontal planes during the running cycle did not significantly differ between the CAI and control groups. Previous studies have shown increased ankle joint inversion during walking and running in individuals with CAI [7]. Therefore, these findings were not in accordance with our hypotheses and some studies. The results could be attributed to the association between joint stiffness and range of motion in the lower extremity. Joint stiffness might be correlated with range of motion. Goodwin et al. [25], who investigated the association between joint mobility and joint stiffness during running, showed that reduced range of motion in the lower extremity including subtalar inversion was associated with increased lower extremity stiffness during running. Lower extremity stiffness played an important role in gaining a ground reaction force during sprinting [26]. Hence, such associations might be applicable in sprinting. Moreover, these findings could also be supported by the anatomical characteristics of the talocrural joint. Larger ankle dorsiflexion angles inhibit ankle mobility in the horizontal and frontal planes. Accordingly, to deliver the mechanical energy generated by the hip and knee joints to the ground and to protect the ankle for CAI, patients with CAI had increased ankle joint stiffness and a larger dorsiflexion angle, which limit ankle joint mobility. Therefore, there were no significant differences in the horizontal and frontal plane ankle joint angles during sprinting between the CAI and healthy control groups due to sprinting features and CAI motor programs.
Finally, in individuals with CAI, altered lower extremity joint angles can have protective effects. That is, they can stabilize and compensate an unstable ankle joint during the stance phase. However, these alterations may cause future orthopedic issues or performance disorders. Larger knee and hip flexion angles at the initial contact can lead to the decreased displacement of the center of mass and increased leg stiffness [27]. Increased leg stiffness may cause increased loading rates or forces on the patellar tendon [27]. In addition, for sprinting performance, smaller knee flexion during the stance phase is an essential kinematic feature of faster maximal speed sprinting [28]. Thus, this study can provide information about the unique joint angles that may negatively affect the sprinting performance of individuals with CAI. Clinicians might narrow the focus of their interventions on improving ankle joint function. However, they should consider the joint angle of the whole lower extremity, particularly in the sagittal plane during sports-related dynamic movements affected by CAI.
The current study had several limitations. First, we did not perform an individual assessment of separate mechanical and functional ankle instabilities. During a few dynamic tasks, there were altered ankle movement patterns between mechanical and functional ankle instabilities [29]. Secondly, only lower extremity joint angles patterns were evaluated. Therefore, further studies must be conducted to analyze kinetic and electromyography patterns in patients with CAI to completely characterize sprinting mechanics. Furthermore, it should be noted that the speed of 7.5m/s used in this study was not determined based on their individual sprint performance. In fact, this speed was determined based on the preliminary experiment in which all participants could safely perform treadmill running. Moreover, this established speed was estimated to be around 75% based on participants’ 100m personal best [30]. Nonetheless, it is possible that the effort level of the participants could have varied, and this may have affected the interpretation of the results. Future studies may consider measuring individual sprint performance to provide further insights on the unique joint angle during sprinting in CAI sprinters.
Conclusions
The lower extremity joint angles during sprinting in the sagittal plane differed between the CAI and healthy control groups. The CAI group demonstrated larger ankle dorsiflexion and knee and hip flexion from the late swing phase to the late stance phase compared to the control group. These altered joint angles could facilitate ankle joint stability and resist large external loads with feed-forward motor programs.
The horizontal and frontal plane ankle joint angles did not significantly differ between the CAI and control groups. Due to sprinting characteristic features and CAI motor programs, the ankle joint mobility was inhibited.